The first step of achieving good returns in the stock market is not losing money. What is the percentage chance of losing money in the stock market?
That depends on the investment style and can be hard to quantify. If you hold a small number of companies in the portfolio, the chance of losing money is greater because if any single company performs badly, the effect on the portfolio will be large.
But say you invest in a large number of companies, say in the companies of some stock index. We cannot be certain of any performance of the selected companies in the future. What we can do is we can look at how the stock market index performed in the past.
To do this, I wanted to have as large amount of data as possible. The most data I could find, is for a stock index S&P 500. The index consists of 500 large companies from the United States (large based on the market capitalization) and in the analysis, data from 1871 to 2016 is used. How the largest 500 companies' stock price move is a good-enough heuristics of how the stock market moves in the United States in general. The source of all data is multpl.com.
Let's say you invested your money into the S&P 500 index at some random year after year 1871, on the January 1, for X number of years. What's the chance your return is positive or negative?
Let's look at the data. Here we suppose all the dividends are paid on the January 1 and reinvested immediately. No tax is applied.
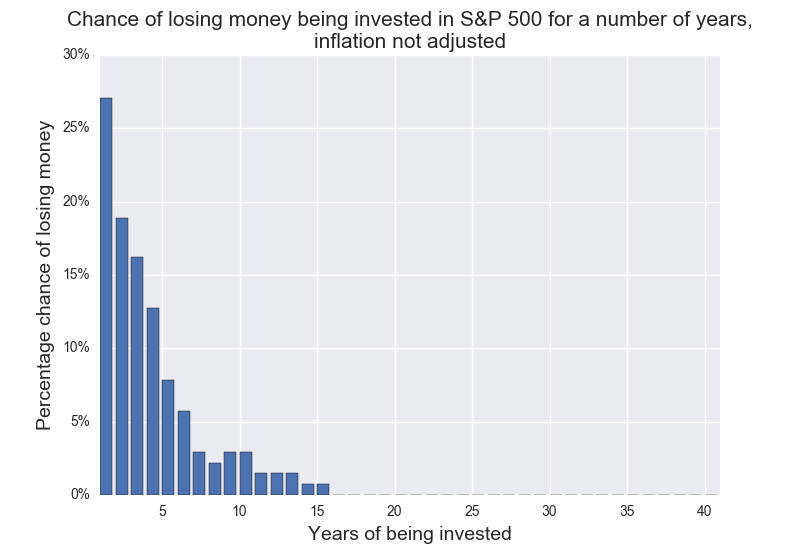
We can see that chance of being profitable depends a lot on how long you are invested. As the common wisdom says, investing in the stock market should be done for a longer term.
The data above used nominal prices, i.e. was not adjusted for inflation. The chart above should be therefore relevant to you if you consider either investing in the stock market or holding cash.
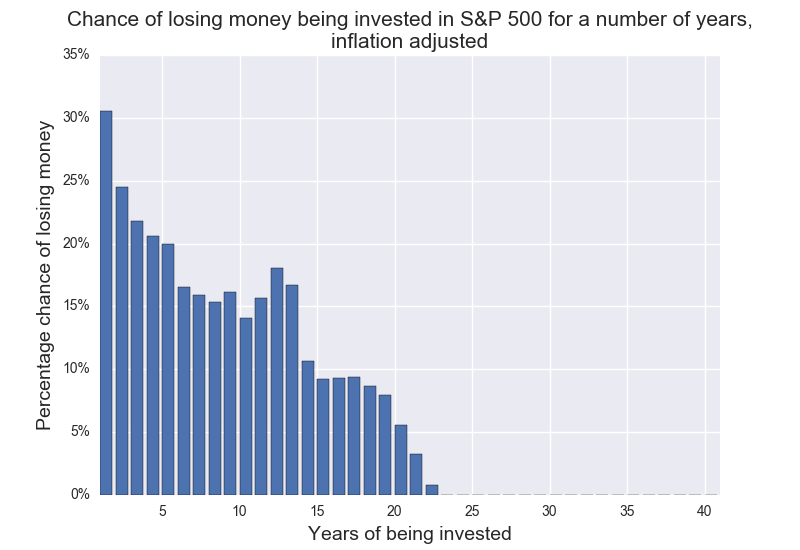
If you consider either investing in the stock money or keeping money in some sort of a financial vehicle (i.e. TIPS, or perhaps a very diverse commodity index), I've also tested the same thing but discounted returns for each year by whatever the inflation (US CPI) was (dividends included).
The chance of beating that vehicle, investing for X years, is shown in the chart below.